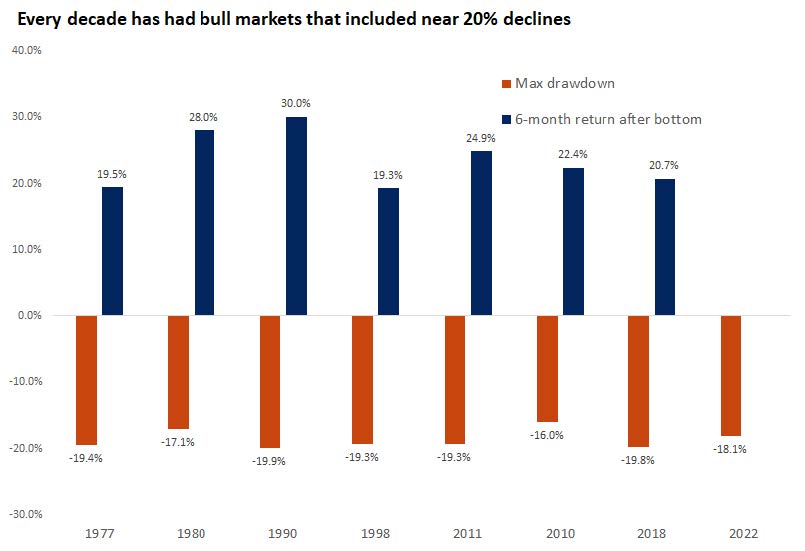
 The standard definition of a bear market is when major U.S. stock indices, such as the S&P 500, drop by 20% or more from their peak. And 5+ months into 2022, we see NASDAQ and the smaller-cap Russell 2000 both in the grips of a bear and the DJIA and S&P 500 darting just outside the claws of a bear (by the time you read this, they could both very well be trapped by a bear or be further away from the claws).
Let’s examine the last time the S&P 500 was in a bear market and a little history of other past bear markets.
The Last Bear
Remember when the S&P 500 closed at a then record high of 3,386 on February 19, 2020 and just three short and very painful weeks later, the S&P closed under 2,500, a drop of 26% in about 16 sessions (the COVID-bear)?
Then, on August 17th, the S&P 500 eclipsed that February 19th high in mid-morning trading, and it mostly managed to stay above that level. In fact, it was the second fastest-ever bear market to market peak in history as it took 126 trading days for the S&P 500 to reclaim its February high.
And this was over 10 times as fast as the index’s average historical rebound (1,542 trading days).
On the one hand, it was the fastest bull-to-bear market in history (COVID). But on the other hand, it was the second fastest bear market recovery in history.
Historical Bear Markets
From the perspective of an investor, there really is nothing special about that 20% threshold that separates a correction from a bear market. Does it matter if the S&P 500 is down 19% versus 21%? Both scenarios probably leave you feeling anxious. But it is worth remembering that every decade has seen bear markets and bull markets.

Why Perspective is Important
Glass half-full investors will undoubtedly focus on the good news – the worst decline in our economy since the Great Depression (the COVID bear) took just 126 days to recover – maybe we will see a similar recovery.
And glass-half-empty investors will undoubtedly focus on the not-so-good news – inflation is at 40-year highs, we have 11 million open jobs, the Fed is raising rates aggressively and corporate earnings are coming in weak – this bear will be more like other historical bears. But long-term investors would be well served understanding both perspectives.
How Do You Feel?
Consider this simple bittersweet example:
• You have $10,000 in your retirement account on January 1st and three months later your online statement shows a value of $7,000.
• About six months later, you open up your account statement and you see a value of $10,500.
• You do some quick math and marvel at how your investments went up 50% from the bottom.
Be honest, how does this make you feel? Probably happy on the one hand, less so on the other, right?
What should you do? Well, the answer to that question, of course, is deeply personal. That being said, it’s never a bad idea to better understand the current macro-economic environment to help make informed decisions.
But the important point to keep in mind is that all the macro-economic data in the world is only helpful as it informs your long-term investing decisions and asset allocations. So before you make any investing changes, make sure you talk to your financial advisor to ensure that your assumptions are consistent with your risk profile and your financial plan.
Copyright © 2022 FMeX. All rights reserved. Distributed by Financial Media Exchange.

